Table of Contents
- The Technical Limitations of Static Map Images
- The Friction of Flat User Experiences
- How Clickable Region Tooltips Solve the Retention Equation
- Switching to Responsive Vector Infrastructure
- Measuring the UX Transformation in Google Analytics
- Conclusion
1. The Technical Limitations of Static Map Images
The Blur and Pixels Dilemma
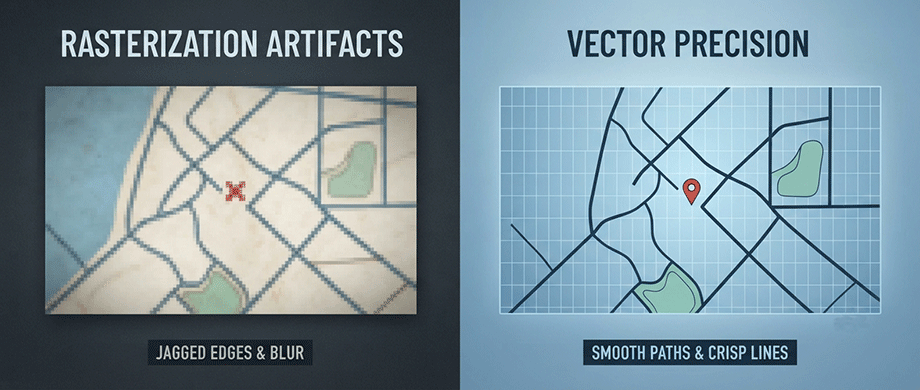
Static image file formats like JPEG and PNG are raster-based assets, meaning they are built from a fixed grid of pixels. When you save a static map image to fit a standard desktop layout, it looks clear only at that specific resolution.
However, when a mobile user attempts to pinch-to-zoom to read a specific street name, city branch, or regional label, the browser stretches those fixed pixels. The map instantly becomes blurry, distorted, and pixelated. This poor image quality makes your site look unpolished and unprofessional. It damages user trust and frustrates visitors who are looking for clear geographical details.
RASTER IMAGE (JPEG/PNG): [ Fixed Pixels ] ──( Zoom In )──> Blurry, Jagged, Unreadable
VECTOR GRAPHIC (SVG): [ Math Paths ] ──( Zoom In )──> Infinite Clarity, Sharp Lines
Accessibility and SEO Dead Ends
Beyond the visual downsides, static map images create an immediate barrier for both search engine web crawlers and assistive accessibility technologies:
- Uncrawlable Text Data: If you write city names, contact details, or office hours directly onto a flat graphic file, search engines cannot read it. To a crawler, that vital local information is invisible code.
- Missing Alt Text Context: While you can add a short image description using an HTML alt tag, a single phrase cannot adequately explain a complex map with dozens of different business locations.
- Accessibility Failures: Screen readers used by visually impaired visitors cannot read text trapped inside flat image layers. This causes your page to fail basic Web Content Accessibility Guidelines (WCAG), which can negatively impact your overall Google quality score.
2. The Friction of Flat User Experiences
The Broken Expectation
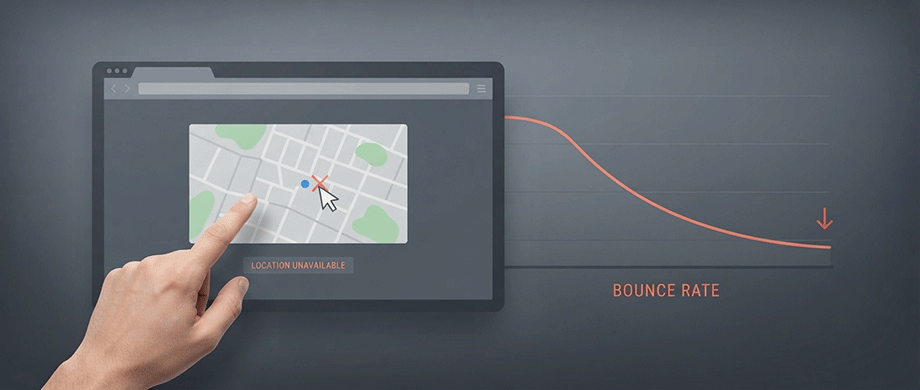
Modern web users have been conditioned by platforms like Google Maps to expect instant interactivity from any geographical asset they see online. When a visitor spots a map on your website, their natural psychological instinct is to interact with it—tapping on a pin, panning across a border, or zooming into their hometown.
When they tap a static JPEG or PNG map and nothing happens, that interaction fails. The image stays flat and unresponsive. This broken expectation creates immediate user frustration. Users feel the site is broken, outdated, or low-quality. This friction triggers a quick exit, causing them to click back to search results and lowering your site's engagement metrics.
USER SPOTS MAP ──> Taps Screen ──> Map is Interactively Dead ──> User Frustration ──> Quick Exit
Information Overload vs. Clean Design
Trying to cram multiple location profiles, phone numbers, and addresses onto a single static image asset creates a visual layout nightmare. Designers are forced to make a difficult choice:
- The Cluttered Mesh: Printing all the regional data directly onto the flat map file fills the graphic with text lines, making it messy, overwhelming, and unreadable on small smartphone viewports.
- The Detached Sidebar List: Hiding the data from the image and listing it in a lengthy text directory below forces users to constantly scroll up and down to match a text address with its spot on the map graphic.
Static layouts cannot solve this issue. They force you to choose between data clutter or bad navigation, whereas interactive modules present clean visuals that only display text on demand.
3. How Clickable Region Tooltips Solve the Retention Equation
Progressive Data Disclosure
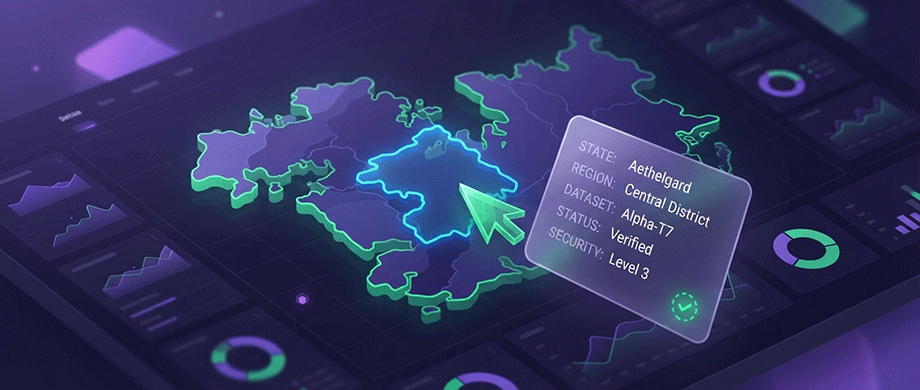
Interactive maps solve the issue of cluttered web design through a design concept called progressive disclosure. Instead of overwhelming a user by showing every piece of local information all at once, your page layout only serves information on demand.
The initial view of the map stays clean, professional, and visually engaging. Detailed text descriptions, store hours, and direct links remain hidden until a visitor interacts with a specific region. The moment they hover their cursor or tap their touchscreen over a location pin, the plugin reveals a sleek, responsive tooltip. This approach keeps your layout tidy while giving users easy access to deeper regional data without cluttering the screen.
Initial Pure Visual Map ──> User Expresses Interest ──> Clean Tooltip Opens ──> Zero Clutter UX
Maximizing Time-on-Page
Every time a user hovers over a custom region, triggers a pop-up window, or filters regional data paths, they are actively participating in your content. This gamified, exploration-style browsing experience directly impacts your technical SEO metrics.
- Extending Session Activity: When users click around a map to discover tooltips, they naturally lose track of time. This extends their session duration effortlessly.
- Lowering Bounce Rates: Because visitors stay on your page longer to explore different geographic regions, your bounce rates drop dramatically.
- Algorithmic Validation: This deep interaction signals to Google's ranking crawlers that your page contains highly helpful, engaging content, protecting your positions in competitive organic search results.
4. Switching to Responsive Vector Infrastructure
The Crisp Clarity of SVGs
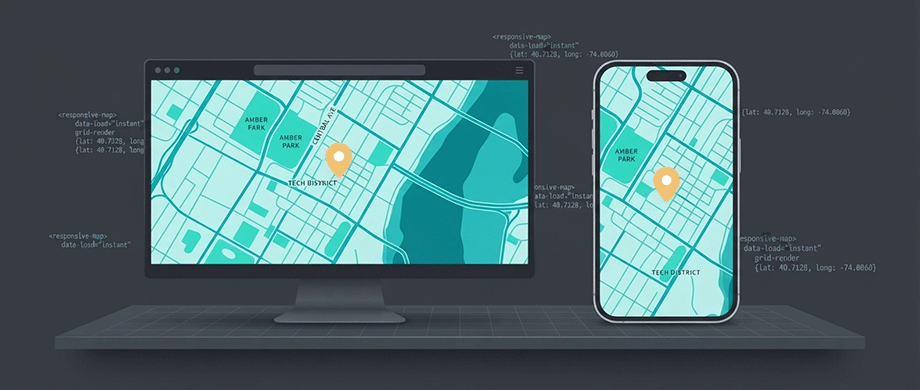
The secret to replacing outdated, heavy image files lies in switching to a modern code-based format: Scalable Vector Graphics (SVG). Unlike pixel-based JPEGs or PNGs, SVGs are built entirely from mathematical coordinate paths.
Because vectors are code rather than compressed pixels, they offer massive technical advantages for your website layout:
- Infinite Scalability: An SVG map scales flawlessly up to giant 4K monitors or down to tiny smartphone displays without losing sharp clarity or adding visual weight.
- Instant Loading Speeds: Vector maps have tiny file sizes because they render directly inside the browser using clean code lines instead of downloading heavy graphic image files.
- Dynamic CSS Styling: You can easily change map borders, landmass background styles, and interactive hover states using standard CSS code.
JPEG Map File ──> Large File Size ──> Slows Mobile Loading ──> Blurry When Zoomed In
SVG Vector Map ──> Tiny Code Script ──> Loads Instantly ──> Perfect Razor-Sharp Lines
Interactive Mapping with WordPress
You do not need to be a professional web developer or a master programmer to replace your old, flat image assets with modern responsive vector graphics. Using a dedicated mapping tool handles all the heavy lifting behind the scenes.
By upgrading your layout with the premium Interactive Map WordPress Plugins, you can transform your static content into a rich, responsive interface in just minutes:
- Simple Visual Builder: You can color-code your regions, link each region to any URL or open a modal window, and write engaging pop-up tooltips using a clean dashboard without touching raw code.
- Native Responsiveness Built-In: The plugin automatically configures your custom maps to fit mobile touchscreens, completely eliminating awkward horizontal scrolling.
- SEO-Friendly Architecture: Because your text data lives inside clean, crawlable JS/HTML instead of an image file, search engine web crawlers can easily scan and rank your regional content.
5. Measuring the UX Transformation in Google Analytics
Tracking Bounce Rate Drops
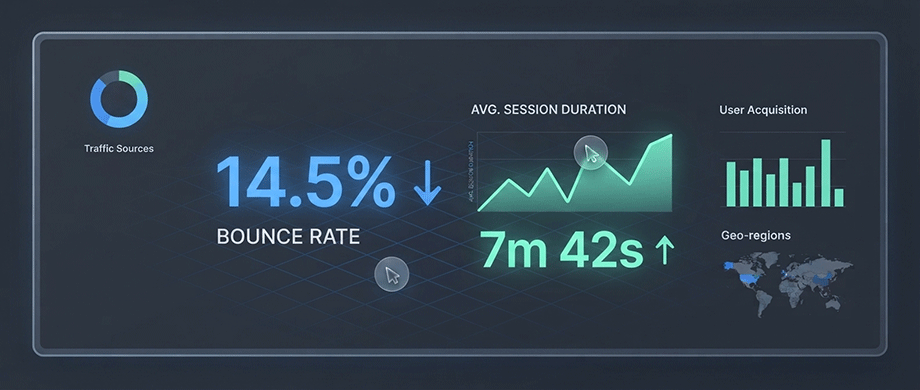
Upgrading your WordPress layout from a static image file to a fully interactive vector map should yield measurable improvements in your site's data logs. To verify this user experience transformation, you must monitor your historical bounce rate and engagement rate trends within Google Analytics 4 (GA4).
- Defining the Before-and-After Baseline: Compare a 30-day traffic window from when your page relied on a flat JPEG map against a 30-day window following your interactive plugin integration.
- Spotting Positive Trends: When a passive graphic is replaced by a clickable interface, your page's bounce rate typically drops as users stop clicking away immediately.
- Confirming Content Relevancy: A steadily climbing engagement rate directly validates that your new visual elements are successfully capturing user interest and keeping readers connected to your page.
For example:
Passive JPEG Layout ──> Bounce Rate Might Be (~85%) ──> Negative Signal to Google Algorithms
Interactive Plugin ──> Bounce Rate Might Be (~35%) ──> Positive Signal to Google Algorithms
Analyzing Interaction Depth
Beyond basic pageview durations, tracking your audience's interaction depth helps you understand how deeply they are exploring your geographic content clusters.
GA4 allows you to configure custom events to track the exact moments users engage with your mapping canvas:
- Scroll Depth Milestone Triggers: Monitor if visitors are scrolling further down your pages after interacting with your map assets, confirming that the visual element acts as an engagement driver rather than an exit point.
- Tooltip Activation Milestones: Track the total count of custom tooltip pop-ups opened per session. A high number of clicks proves that readers are leaning forward to consume your hidden regional data.
- Internal Navigation Click Paths: Track how often users click direct links embedded inside your map tooltips to visit deeper article landing pages, proving that your map successfully guides users through your site architecture.
Conclusion: Say Goodbye to Static Dead Ends
Static JPEG and PNG maps act as visual dead ends that hurt your website’s user experience, create mobile browsing issues, and hide valuable data from search engine web crawlers. Transitioning to dynamic vector-based layouts preserves your loading speeds, scales beautifully on any screen size, and gives your audience a reason to stay on your site longer.
By utilizing clickable tooltips and responsive vector shapes, you feed search engines the behavioral and technical data points they need to boost your organic search rankings. If you are ready to eliminate high bounce rates and replace your flat images with fluid, high-value visual interfaces, discover how our premium Interactive WordPress Map Plugins can upgrade your site's user experience today!

About the Author
Botrous Kerolos has been designing and building interactive maps for the web since 2009 — from early Flash/SWF maps to modern SVG — and leads development at WP Map Plugins, helping WordPress sites turn static content into fast, accessible, interactive experiences.