Table of Contents
- Travel Blogs: Immersive Journey Mapping
- Real Estate: Virtual Property Exploration
- Education and Storytelling: Data-Driven Narratives
- Dynamic Real-Time Data: Retail and Logistics
- Creative Image-Based Maps: Beyond Geography
- Urban Planning: Visualizing Future Cities
- Collaborative Trip Planning: Shared Adventures
- Interactive Marketing: Product Showcases
- 3D Storytelling: Immersive Journalism
- Conclusion
1. Travel Blogs: Immersive Journey Mapping
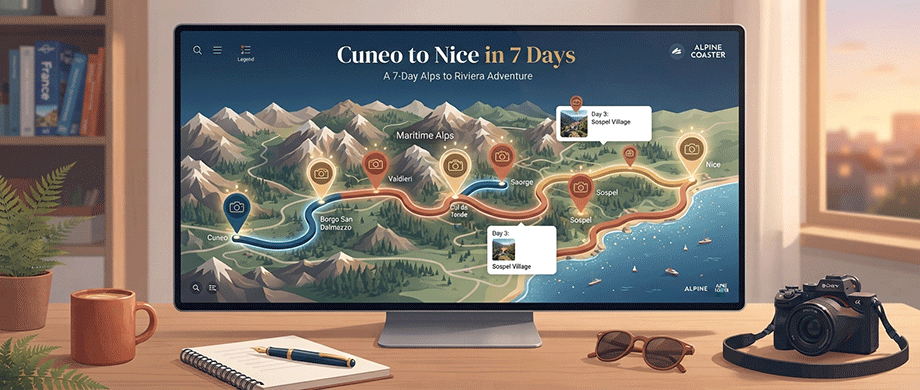
The 3D Travelogue
Travel bloggers are increasingly using interactive 3D maps to transform simple route descriptions into immersive visual narratives. One compelling example documents a 7-day journey from Cuneo to Nice along the Italian-French coast, using a 3D map where readers can rotate, tilt, and zoom through the terrain.
Each stop along the route features clickable 3D pins that open pop-ups with photos, stories, and links, allowing readers to explore destinations at their own pace. This approach solves a common problem: traditional travel guides with dense text and static photos struggle to hold attention. By creating an interactive visual journey, bloggers keep readers engaged longer, increasing dwell time and ad revenue potential.
Key Lessons:
- Replace static route descriptions with explorable 3D terrain.
- Use clickable pins with rich media pop-ups for each destination.
- Allow users to control their exploration—zoom, rotate, and tilt.
- Export high-resolution map images for blog posts and social media.
The Personal Travel Log
Another inspiring example comes from the Slow Camino blog, which features a custom interactive map tracking the author's journey through South America. Clicking on markers reveals slideshows with postcard-style images, brief descriptions, and links to full articles.
What makes this particularly effective is the color coding: darker red markers indicate more recent visits, while lighter pink shows older destinations. This simple visual cue gives users immediate context about the timeline of the journey. The map also features a "Fly To" button that zooms into areas with dense marker clusters, preventing overcrowding on the main view.
Key Lessons:
- Use color coding to convey temporal or categorical information.
- Include slideshows within tooltips for richer storytelling.
- Implement zoom-to-cluster features for dense areas.
2. Real Estate: Virtual Property Exploration
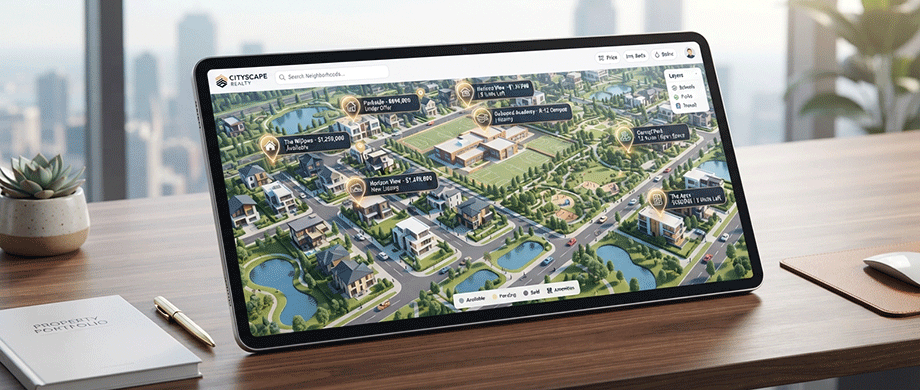
Realtor FlyAround Feature
Platforms such as Realtor has a flyAround feature which represents a breakthrough in virtual property exploration. Using Google Maps Platform's 3D Maps technology, FlyAround delivers a drone-like 360-degree aerial view of properties, allowing buyers to see not just the home but its entire environment—backyard slope, nearby highways, and sunlight patterns.
The impact has been significant: since launching FlyAround in October 30, 2025, Realtor.com saw a 2x increase in mobile map engagement, with roughly 10% of listing detail page visitors interacting specifically with the 3D view. For buyers considering homes "sight unseen"—nearly half of today's buyers—this immersive experience builds confidence that static photos simply cannot provide.
Key Lessons:
- Provide 360-degree drone-like perspectives of properties.
- Answer questions static photos can't (slope, surroundings, sunlight).
- Make maps the centerpiece of the user experience—they're often the most interacted-with feature.
Deyaar Interactive Map
The results speak for themselves: the map accelerated sales, increased inquiries, and generated more qualified leads, all while reducing the workload on sales staff. For developers, this demonstrates how interactive maps can serve as both marketing tools and sales enablers.
Deyaar Properties in Dubai created an interactive 3D map that allows potential buyers to independently explore available properties without contacting sales agents first. Users can filter properties by type, view detailed information, and compare options—all from any device. According to the developer, the tool is designed to increase engagement, generate more qualified inquiries, and reduce the workload on sales staff by providing a self-service exploration experience. For developers, this demonstrates how interactive maps can serve as both a powerful marketing tool and a sales enabler.
Key Lessons:
- Empower buyers to self-serve and explore independently.
- Make maps accessible from any device.
- Use maps to reduce sales team workload while increasing engagement.
Uptown Dubai Interactive Masterplan
For large-scale developments, Uptown Dubai's Interactive 3D Masterplan shows how maps can sell a vision before construction is complete. The tool allows users to explore over 10 million square feet of mixed-use space, view floor plans, apply filters, compare options, and even take 360° tours of key locations—all in a browser. As detailed in the project case study, this approach is designed to serve three key purposes: acting as an internal tool for sales teams, a compelling marketing asset for external presentations, and a tool for creating an emotional connection that lets future residents "walk" through the area before it's built.
Key Lessons:
- Show not just what exists, but what will exist.
- Combine maps with floor plans and 360° tours.
- Create tools for both internal sales teams and external buyers.
3. Education and Storytelling: Data-Driven Narratives
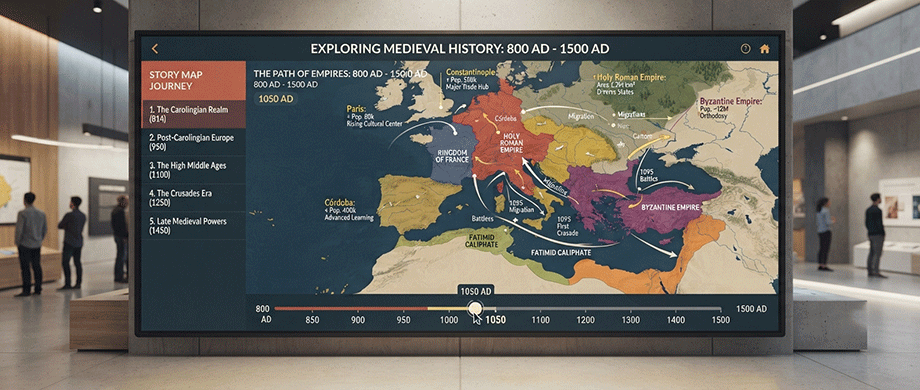
US Historical Counties Through Time
Kerry Bannen's Mapbox project visualizes the history of U.S. county boundaries, allowing users to scroll through time and watch borders shift and evolve. The map includes a time slider, present-day state outlines for orientation, and optional layers showing Indigenous territories—adding crucial historical context.
What makes this example exceptional is its use of maps as storytelling devices. Rather than simply displaying data, the map tells a story of colonization, expansion, and change. By incorporating Native Land data, the creator ensured the map didn't inadvertently erase Indigenous presence, demonstrating thoughtful, ethical map design.
Key Lessons:
- Use maps to tell stories, not just display data.
- Include time sliders for historical or temporal data.
- Consider the ethical implications of what your map shows (and doesn't show).
NASA StoryMaps
NASA's My NASA Data StoryMaps combine authentic Earth science data with interactive maps and storytelling elements. Built around the 5-E learning model (Engage, Explore, Explain, Elaborate, Evaluate), these resources help students explore Earth system processes through dynamic visuals and narratives.
Each StoryMap integrates real NASA data, supports educational standards, and encourages inquiry-based learning. This model demonstrates how maps can be powerful educational tools when combined with structured learning frameworks.
Key Lessons:
- Combine real data with narrative to make complex topics accessible.
- Structure content around learning or exploration frameworks.
- Make maps interactive and inquiry-driven.
4. Dynamic Real-Time Data: Retail and Logistics
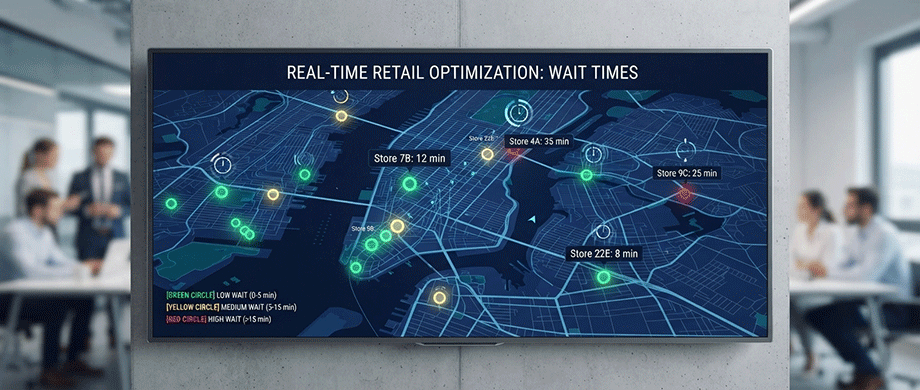
Advanced Markers for Real-Time Data
Google Maps Platform's Advanced Markers enable dynamic map experiences where marker attributes update based on real-time data. One example uses retail store wait times: markers change color (green, yellow, red) and content based on current queue lengths, helping users choose where to shop.
This architecture applies to many use cases: hotel room availability, parking space availability, and restaurant open/closed status. The map updates dynamically, maintaining a sense of freshness and providing immediate value to users.
Key Lessons:
- Update markers dynamically based on real-time data.
- Use color coding to convey urgency or status at a glance.
- Apply this approach to any time-sensitive information display.
5. Creative Image-Based Maps: Beyond Geography
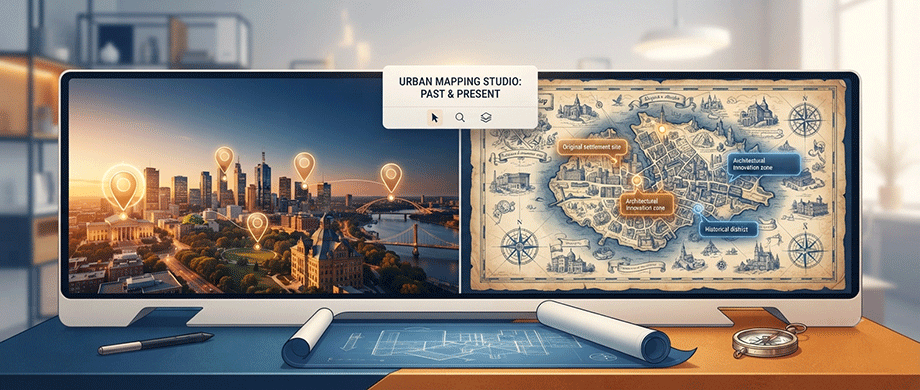
Image Tours and Choreography
ArcGIS StoryMaps allows creators to use images as map bases, opening creative possibilities beyond traditional geography. One example uses a panoramic photo of Pittsburgh's skyline as the "map," with pins pointing to specific buildings and landmarks—a self-guided tour of the photo itself.
Another example shows image choreography: a series of slides with images of the same skyline from different time periods, allowing viewers to watch the city transform over decades as they scroll. This technique turns static images into interactive, layered experiences.
Key Lessons:
- Use images as map bases for non-geographic content.
- Create tours of artwork, schematics, or family trees.
- Layer multiple images to show change over time.
6. Urban Planning: Visualizing Future Cities

Interactive Masterplan for Urban Development
Uptown Dubai's Interactive 3D Masterplan exemplifies how maps can shape the future of cities. The tool allows users to explore an entire district, view floor plans, apply filters, and take immersive tours—all in a browser without additional software.
This approach benefits multiple stakeholders: sales teams use it with clients in real time, marketing departments integrate it into external presentations, and future residents "walk" through the area before construction completes. The combination of technical accuracy and visual appeal makes the tool effective for both decision-making and emotional connection.
Key Lessons:
- Create maps that serve multiple stakeholder needs.
- Make complex developments easy to explore and understand.
- Combine accuracy with emotional appeal.
7. Collaborative Trip Planning: Shared Adventures
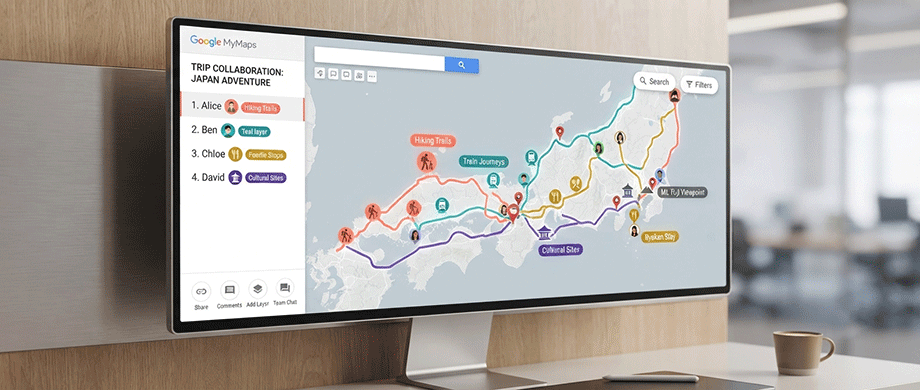
Google MyMaps for Group Planning
Google MyMaps has emerged as a powerful collaborative planning tool for travelers. Users can create blank projects, invite friends to add recommendations, and layer different route options on top of each other.
Google MyMaps has also proven valuable for collaborative trip planning. As Sai Siddharth wrote in the Mumbai Mirror, one traveler described planning a Kerala road trip by adding every recommendation from friends, then layering route options on top. The ability to toggle layers on and off made it easy to visualize how points and routes interact. The tool also supports sharing, allowing trip plans to evolve collaboratively—though, as Siddharth wryly noted, "NotTotallyMyMaps" might be needed once friends start changing the plan.
Key Lessons:
- Enable collaborative map creation for group planning.
- Use layers to organize different types of information.
- Make maps shareable and editable by multiple users.
8. Interactive Marketing: Product Showcases

Shoppable Maps for Commerce
Interactive maps are increasingly used for product showcases and e-commerce. By mapping products or store locations with clickable pins, brands create engaging shopping experiences. For example, a retail brand might map its store locations with pins showing inventory levels, or a furniture company might map showroom layouts with clickable product details.
Key Lessons:
- Map product locations with detailed information on click.
- Combine maps with e-commerce functionality.
- Use maps to guide users through physical or digital spaces.
9. 3D Storytelling: Immersive Journalism
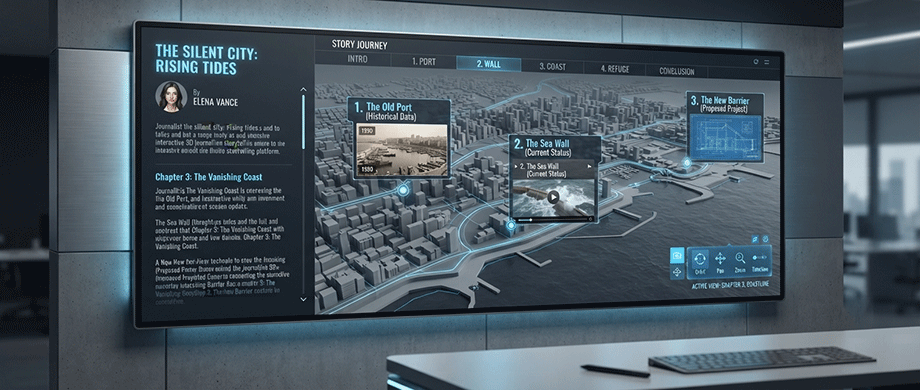
Google's 3D Storytelling Solution
Google's 3D Storytelling Solution empowers journalists, travelers, and educators to craft immersive narratives integrated with geographic landscapes. Built on Google Maps Platform's photorealistic 3D Tiles, the solution offers interactive chapters, dynamic camera control, and a configurable JSON structure.
Journalists can enhance stories with location-based context; travelers can chronicle journeys in visually stunning ways; educators can create immersive learning experiences. The solution includes both an Admin app for customization and a Demo app for the final user-facing experience.
Key Lessons:
- Use 3D maps for immersive storytelling across industries.
- Enable configurable structures for different use cases.
- Provide both customization tools and polished end-user experiences.
Conclusion: Find Inspiration for Your Own Interactive Map
These 10 examples demonstrate the incredible versatility of interactive maps in modern web design. From travel bloggers creating immersive journey narratives to real estate developers selling properties before they're built, interactive maps are transforming how we present spatial information.
The common threads across all successful examples are clear:
- User experience first: Maps should be intuitive, responsive, and accessible.
- Storytelling focus: Maps are tools for narrative, not just data display.
- Seamless integration: Maps should feel like natural extensions of your content.
- Performance matters: Fast-loading maps with smooth interactions keep users engaged.
Whether you're planning a travel blog, launching a real estate website, creating educational content, or building a corporate site, interactive maps can elevate your user experience and drive engagement.
If you are ready to bring inspiring interactive maps to your own website, discover how our premium Interactive WordPress Map Plugins can help you create stunning, self-hosted SVG maps.

About the Author
Botrous Kerolos has been designing and building interactive maps for the web since 2009 — from early Flash/SWF maps to modern SVG — and leads development at WP Map Plugins, helping WordPress sites turn static content into fast, accessible, interactive experiences.