Table of Contents
- Why Interactive Maps Transform History Education
- Types of Historical Map Visualizations
- Tools for Creating Interactive Historical Maps
- Designing Educational Map Activities
- Real-World Examples from History Education
- Measuring Impact and Assessment
- Technical Considerations for Historical Maps
- Conclusion
1. Why Interactive Maps Transform History Education
Making Abstract Concepts Concrete
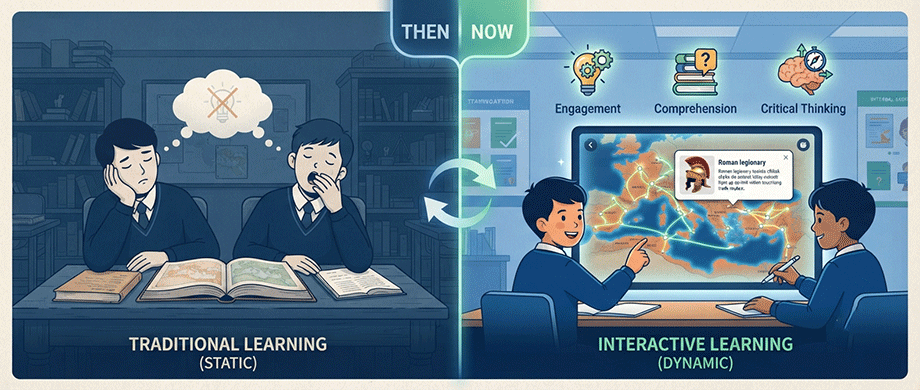
Traditional history instruction often struggles with abstract material and monotonous delivery, leading to reduced student interest and passive participation. Historical events are complex, involving multiple factors unfolding across vast distances. Static maps and text descriptions simply cannot capture this complexity effectively.
Interactive maps address this challenge by making abstract historical concepts more concrete and tangible. When students can see a trade route snaking across a continent, click on cities to learn about goods exchanged, and watch the route change over time, they develop a far richer understanding than reading about it in a textbook.
Fostering Active Learning and Critical Thinking
Interactive maps shift students from passive consumers of information to active explorers. Instead of simply reading what happened, they can:
Formulate hypotheses about why events unfolded in specific locations.
Analyze geographic factors that influenced historical outcomes.
Draw conclusions by synthesizing spatial and temporal data.
Question sources by examining how maps reflect the perspectives of their creators.
This active engagement promotes deeper learning and critical thinking skills that extend beyond the history classroom
The Emotional Connection
Maps are not just neutral representations of space; they are subjective texts created by individuals and groups who decide what to include and what to leave out. Interactive historical maps reveal this subjectivity, helping students understand that history is not simply "what happened" but "what has been recorded and interpreted.".
When students engage with maps that incorporate personal archival materials, oral histories, and diverse voices, they connect emotionally with the past in ways that textbooks cannot replicate. Projects that integrate eyewitness testimonies, personal correspondence, and photographs create powerful, pluralist historical narratives.
2. Types of Historical Map Visualizations
Time-Lapse and Animated Maps
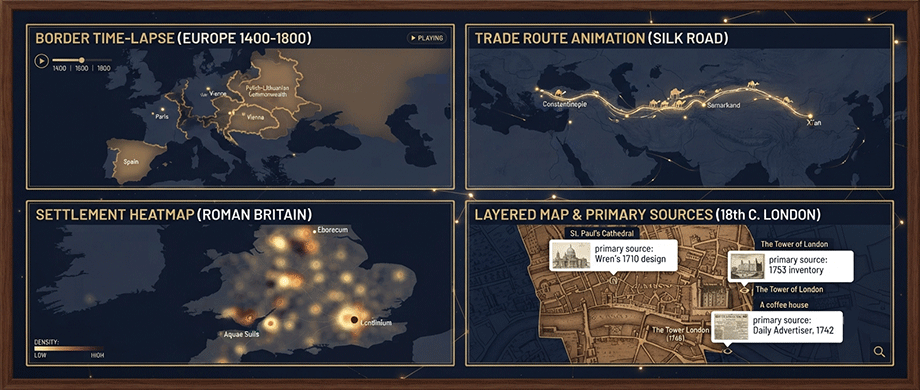
One of the most powerful features of interactive historical maps is the ability to show change over time. Animated maps allow users to watch borders shift, empires expand, and populations migrate across centuries.
World History Maps: The World displays the entire world for every single year in recorded history—an unprecedented level of temporal detail. Users can scroll forward and backward through years, pin specific years for comparison, and zoom in on even the smallest countries. This granularity gives students a unique perspective on historical change that cannot be found in traditional atlases.
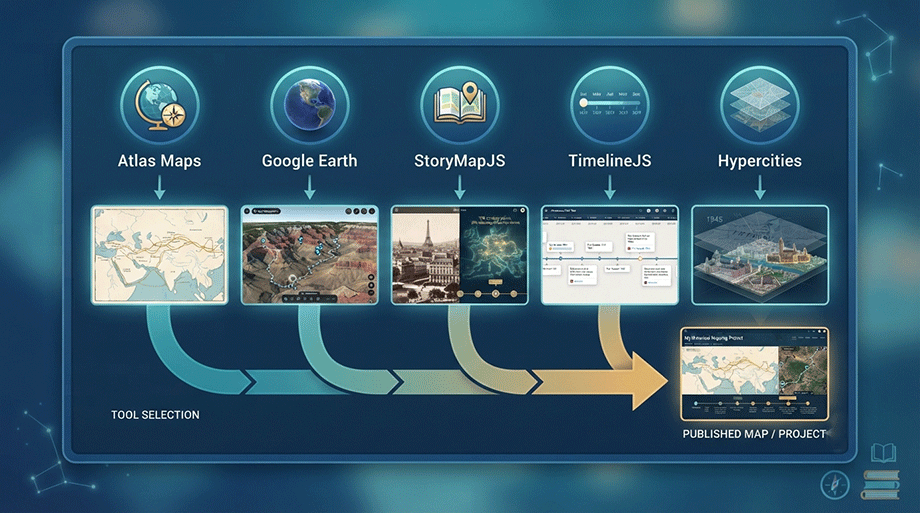
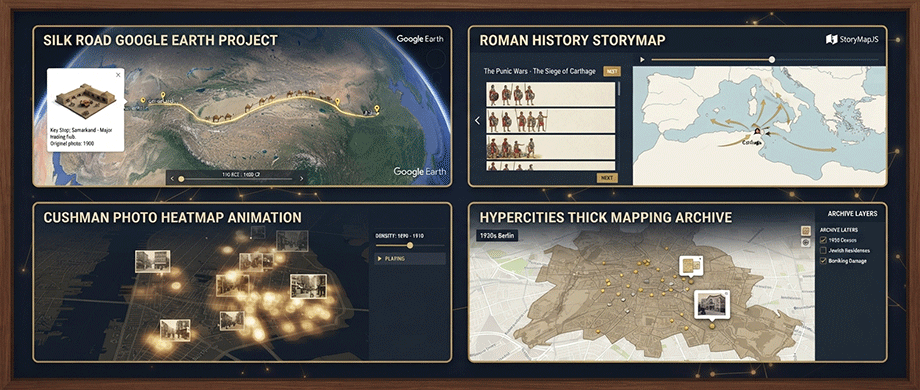
Hypercities: offers powerful timeline manipulation features that allow users to layer historical maps, documents, images, and videos over time. This "thick mapping" approach enables deep exploration of how cities and regions evolved across decades and centuries.
Trade Routes and Journey Maps
Historical trade routes—from the Silk Road to maritime spice routes—are ideal subjects for interactive mapping. By tracing routes, marking key cities, and embedding information about goods, cultures, and travelers, these maps bring economic and cultural history to life.
The Silk Road Seattle project demonstrates this approach effectively. Interactive map quizzes help students master the geography of the Silk Road by clicking on locations to test their knowledge. The Silk Road Big Map activity has students create oversized physical maps, then add layers of information including topographic features, trade products, and the routes of famous travelers.
Google Earth projects allow students to trace the journeys of historical travelers, creating interactive maps that integrate placemark descriptions, images, and research papers. Students in one university course mapped the journeys of figures from Alexander the Great to Marco Polo, producing work that far exceeded expectations.
Heatmaps and Density Visualizations
Heatmaps reveal patterns in historical data—where events occurred, where populations concentrated, where trade flourished. By visualizing density and distribution, these maps help students identify trends and ask new questions.
A student project mapping the locations of Charles W. Cushman's photographs used a heatmap animation to show how his photographic journey expanded over time. The heatmap made it much easier to see patterns in his travels and highlight the places he was most drawn to.
Layered Primary Source Maps
Interactive maps can serve as platforms for exploring primary sources in their geographic context. By placing documents, photographs, and oral histories on a map, students can see how sources relate to specific locations and to each other.
Docsteach's Mapping History tool allows educators to plot primary sources, descriptive text, and student response boxes on historical or outline maps. Students can move document markers to demonstrate geographic understanding, and educators can design activities around document analysis and placement.
Hypercities excels at layering historical street maps, documents, images, and videos over a single geographic location, allowing for pluralism and the foregrounding of marginalized experiences. Projects like the L.A. Research Collection integrate personal archival materials and narratives with census and demographic data.
3. Tools for Creating Interactive Historical Maps
WordPress Map Plugins
For educators and history bloggers using WordPress, dedicated map plugins offer the easiest path to interactive historical maps:
WPMapPlugins are interactive SVG map plugins that builds responsive world, Europe, and US maps with clickable regions, tooltips. Key features include:
- No coding required: Create and customize maps directly in the WordPress admin.
- No external APIs: All maps are self-hosted SVG, no Google Maps keys needed.
- Clickable regions: Each country, state, or region can link to any URL.
- Customizable tooltips: Use dynamic fields for region names, descriptions, and more.
- Fully responsive: Maps adapt to phones, tablets, and desktops.
- Simple shortcode: Embed maps anywhere with
[world_map].
For historical maps, educators can create maps where each region links to detailed articles, primary sources, or student projects. The ability to customize tooltips with dynamic fields means each location can display relevant historical information.
Google Earth and Google Maps
Google Earth: remains one of the most powerful tools for historical mapping in education. While it requires more technical setup than WordPress plugins, it offers unparalleled capabilities:
- 3D terrain: Students can explore historical sites in three dimensions.
- KML customization: Create rich placemarks with formatted text, images, and links.
- Time animation: Display historical data across time periods.
- Global coverage: Access to satellite imagery and terrain data worldwide.
The Teaching Silk Road History project at UC Merced demonstrated Google Earth's potential. Students created interactive maps of Silk Road travelers' journeys, integrating placemark descriptions, images, and research papers. The project was immensely rewarding, with 80% of students reporting they learned more than in standard history courses.
Google Maps (via the web) offers simpler integration for classroom projects. Tools like Scribble Maps enable students to draw and write on Google Maps, mapping historic events, creating timelines, and annotating historic sites.
StoryMap and Timeline Tools
StoryMapJS and TimelineJS are open-source tools for building visually rich, interactive narratives. These tools work exceptionally well for history education:
- StoryMapJS: Create maps that tell stories through slides, each with a location and media.
- TimelineJS: Build interactive timelines with images, videos, and text.
- No coding required: Simple interfaces for building professional-looking projects.
- Collaborative potential: Students can work together on group projects.
Professor Beth Pollard's Roman History course used these tools to scaffold a series of projects, guiding students from low-stakes workshops to a high-stakes digital humanities project. The structured approach helped students master the tools while building historical knowledge
ESRI StoryMaps offers a more advanced alternative, integrating with GIS data and academic sources. Professor Sureshi Jayawardene used StoryMaps in a course on the Black Urban Experience, with students creating projects that combined maps, images, videos, and texts to illustrate urban narratives
4. Designing Educational Map Activities
Using the DocsTeach Mapping History Framework
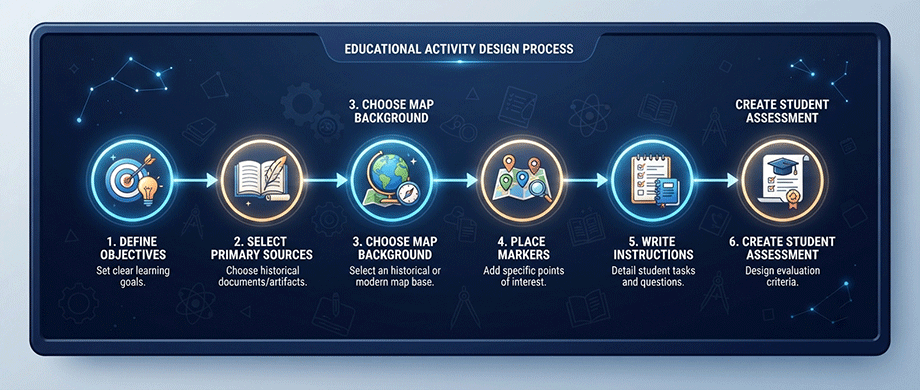
The National Archives' DocsTeach platform offers a structured framework for creating historical map activities. The Mapping History tool allows educators to:
Define Learning Objectives
Activities should target specific learning goals:
- Use geographic information to formulate historical conclusions.
- Understand the impact of geography on history and society.
- Visualize place and location themes.
- Explore human-environment interaction and movement.
- Appreciate changes to society over time.
Select Primary Sources
Choose documents that reference locations or geographic themes. Include historical maps as backgrounds, or use outline maps for student placement activities. Add text annotations and upload images from beyond the National Archives.
Design the Activity
- Choose a background image (historical map, outline map, or uploaded document).
- Place markers for documents, text, and student responses.
- Write instructions including introduction and conclusion.
- Add questions or follow-up assignments.
Teaching Tips
- Model document analysis: Walk students through at least one document before they begin.
- Explain placement reasoning: Students should always explain why they placed documents where they did.
- Hypothesize first: Ask students to hypothesize about document placement before formally beginning.
- Follow with discussion: Use class discussion to contextualize documents and historical conclusions.
- Compare historical and contemporary maps: Students can see how maps have changed over time.
Scaffolding for Success
Complex digital projects require careful scaffolding. The UC Merced Silk Road course demonstrated effective scaffolding principles:
- Short assignments leading to a final project: Each assignment built on the previous one.
- Regular feedback: Instructor feedback throughout the semester.
- Extended office hours: Additional support for technical challenges.
- Detailed rubrics: Clear expectations for each component of the project.
The Visualizing Roman History project used similar scaffolding, guiding students through a series of low-stakes workshops before the final high-stakes project. This approach helped students build confidence and skills gradually.
5. Real-World Examples from History Education
Silk Road Google Earth Projects
The Teaching Silk Road History project at UC Merced stands as a model for integrating interactive maps into history education. Students selected a Silk Road travel narrative, wrote a research paper, and created an interactive Google Earth map depicting the traveler's journey.
Student feedback was overwhelmingly positive:
- "It allows us to view different regions and see how cultures spread out through history".
- "The spatial approach helps put history into perspective".
- "When I become a teacher, I will definitely use tools like the ones we have learned this semester".
- "It is sooooo nice to use Google Earth in learning about history".
Hypercities Urban History Archives
Hypercities projects demonstrate the power of "thick mapping" for urban history. The L.A. Research Collection integrates personal archival materials and narratives from Los Angeles's historic Filipinotown with census and demographic data. The Tehran Election Protests 2009 project provides a street-level interactive guide to protests and violence following the contested election.
These projects function as "real-time, polyvocal geospatial archives" that preserve multiple perspectives on historical events. They demonstrate how interactive maps can foreground marginalized experiences and challenge dominant historical narratives.
StoryMapJS for Roman History
Professor Beth Pollard's Roman History course used StoryMapJS and TimelineJS to help students create digital humanities projects. The collaboration included:
- Scaffolded workshops: Low-stakes projects building toward a final assignment.
- Detailed help sheets: Clear guidance for each tool.
- Assessment rubrics: Clear expectations for grading.
- Embedded examples: Students could see successful projects from previous semesters.
The results demonstrated that even students without technical backgrounds can create sophisticated digital projects with proper support.
6. Measuring Impact and Assessment
Research Findings
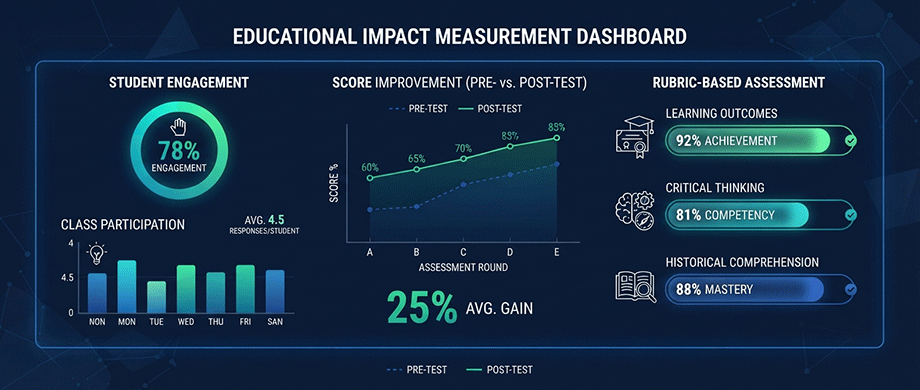
Studies on interactive historical maps consistently demonstrate positive educational outcomes:
- Validation results indicate high feasibility from expert evaluations.
- Pre-test and post-test scores show significant improvement across educational levels.
- Student engagement and motivation increase substantially.
- Active learning and critical thinking are fostered.
- Independent study is encouraged.
Assessment Strategies
Assessing student work with interactive maps requires careful planning:
Develop Clear Rubrics
- Define expectations for each component of the map project.
- Include content accuracy, technical execution, and historical analysis.
- Provide the rubric to students before they begin.
Use Scaffolded Assignments
- Break the project into smaller assignments due throughout the semester.
- Provide feedback on each component.
- No single assignment should be worth more than 30% of the final grade.
Evaluate Both Process and Product
- Assess students' research process, not just the final product.
- Ask students to explain their historical reasoning.
- Include reflection on what they learned.
7. Technical Considerations for Historical Maps

Choosing the Right Map Format
For historical maps on educational sites, wpmapplugins offer significant advantages:
- No external API dependencies: Maps work without Google Maps keys or third-party services.
- Fully responsive: Maps adapt to phones, tablets, and desktops.
- Clickable regions: Each country, state, or region can link to content.
- Self-hosted: No external data loading or performance concern.
Responsive Design
Students access educational content on a wide range of devices. Historical maps must be fully responsive, automatically adapting to different screen sizes. Look for solutions that:
- Scale appropriately on phones, tablets, and desktops.
- Maintain readable text at all sizes.
- Keep clickable regions functional on touch devices.
Accessibility
Historical maps must be accessible to all students. Ensure:
- Color contrast: Meets WCAG standards for readability.
- Alternative content: Provide text descriptions of map data for students with visual impairments.
Conclusion: Bringing History to Life with Interactive Maps
Interactive historical maps transform how we teach and learn about the past. They make abstract concepts concrete, foster active learning and critical thinking, and help students connect emotionally with historical narratives.
The tools and frameworks are accessible to educators at all levels:
- WordPress Map Plugins: make map creation simple and code-free.
- Google Earth: offers powerful capabilities for advanced projects.
- StoryMapJS and TimelineJS: enable collaborative, media-rich narratives.
- Hypercities: provides a platform for deep, pluralist historical archives.
The key to success is careful design: define clear learning objectives, select appropriate primary sources, scaffold assignments to build student confidence, and assess both process and product.
Interactive maps are not just tools—they are invitations to explore, question, and understand. By bringing historical geography to life, we help students see the past not as a static collection of facts, but as a dynamic, interconnected story that continues to shape our world.

About the Author
Botrous Kerolos has been designing and building interactive maps for the web since 2009 — from early Flash/SWF maps to modern SVG — and leads development at WP Map Plugins, helping WordPress sites turn static content into fast, accessible, interactive experiences.