Table of Contents
- Why Event Sites Are Still Stuck on Flat Floor-Plan Images
- What Attendees Actually Try to Do With a Floor Plan
- Building a Clickable Exhibitor Directory
- Handling Multi-Hall, Multi-Level Venues
- The SEO Angle: A Floor Plan That Google Can Actually Index
- Reusing the Map Year After Year
- Conclusion
1. Why Event Sites Are Still Stuck on Flat Floor-Plan Images
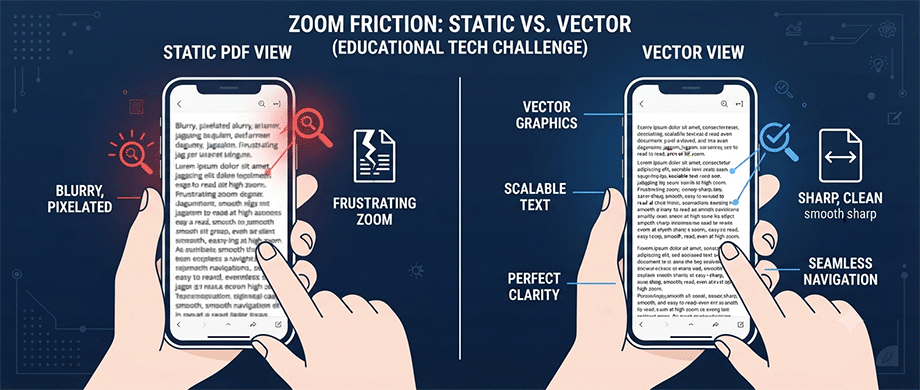
We have all been there: standing in a crowded convention center, squinting at a PDF on our phone, trying to pinch-and-zoom a blurry low-res JPEG to find "Booth 404." Despite the obvious friction, many event organizers stick to static images because they are easy to "export and forget" from their print brochures.
- The Usability Gap: Static maps are "aesthetic documents" that often fail in the real world. They force the user to do the work—scanning grid coordinates (e.g., "Hall B, Aisle 4") rather than simply searching for a name.
- Mobile Failure: On mobile devices, large PDF floor plans are notoriously difficult to navigate. They require excessive scrolling and often lack the resolution needed to read booth numbers when zoomed in, leading to a high "abandonment" rate where attendees just ask staff for directions instead.
2. What Attendees Actually Try to Do With a Floor Plan
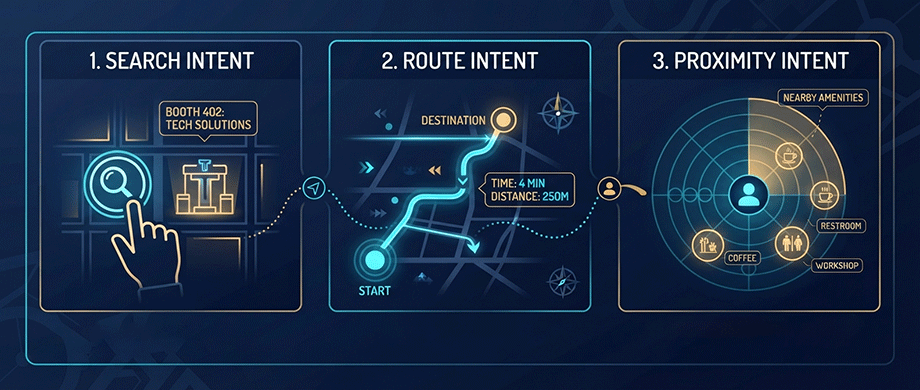
Attendees rarely look at a map just to appreciate the layout. Their intent is almost always transactional and time-sensitive.
- "Where is [Company X]?": This is the primary query. A static image requires a visual scan; an interactive map allows for an instant search.
- "How do I get there from here?": In large venues, attendees need to route between sessions (e.g., "Main Stage" to "Breakout Room B"). A static map cannot show a path or estimate walking time, which is critical for tight schedules.
- "Who is near me?": Attendees with spare time want to see who is exhibiting in their immediate vicinity, a discovery process that static maps make difficult.
3. Building a Clickable Exhibitor Directory
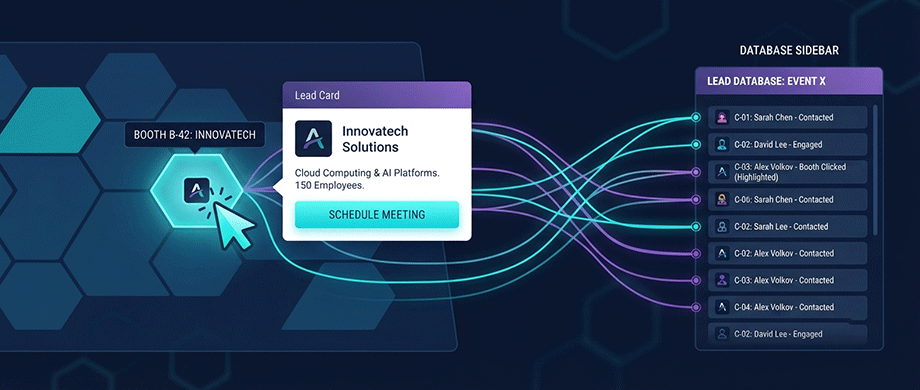
The most significant upgrade you can make is turning your floor plan into a functional directory.
- Clickable Regions: Instead of dead pixels, each booth becomes an interactive "region" (usually an SVG polygon). When tapped, it triggers a modal or tooltip.
- The "Micro-Site" Approach: This tooltip shouldn't just show the name. It should link to the exhibitor’s full profile, show their logo, and even offer a "Schedule Meeting" link. This turns the map from a navigation tool into a lead-generation tool.
- Category Filtering: Interactive maps allow users to toggle layers. An attendee interested in "Robotics" can click a filter, and the map dims all other booths, highlighting only the relevant ones—something physically impossible with a printed map.
4. Handling Multi-Hall, Multi-Level Venues
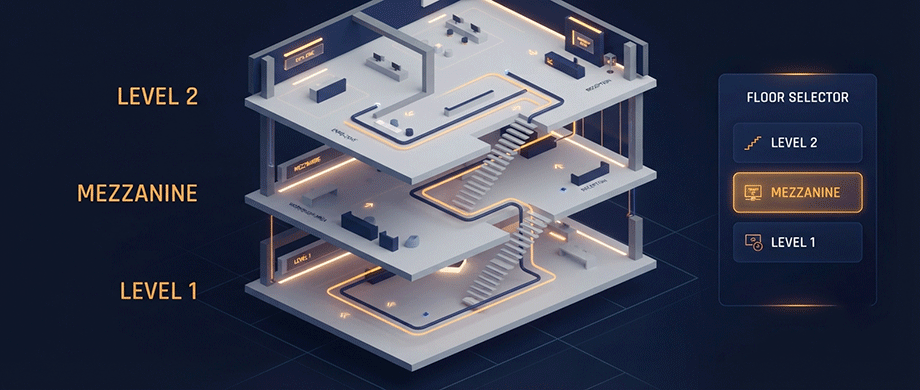
Complex venues with multiple floors or detached halls (like Las Vegas or Dubai convention centers) break standard image viewers.
- The "Scene" Selector: Do not force users to scroll down a giant page of stacked images. Use a "Floor Selector" (Level 1, Level 2, Mezzanine) that swaps the map view instantly without reloading the page.
- Linked Maps: Treat distinct halls as separate "scenes." A clickable exit on the "Main Hall" map can be a deep link that loads the "Outdoor Pavilion" map, maintaining the user's context.
- Detail Levels: Use zoom-dependent rendering. At a high level, show "Zones" (e.g., "Tech Village"). As the user zooms in, reveal individual booth numbers and labels. This prevents the "clutter" that makes static maps unreadable.
5. The SEO Angle: A Floor Plan That Google Can Actually Index
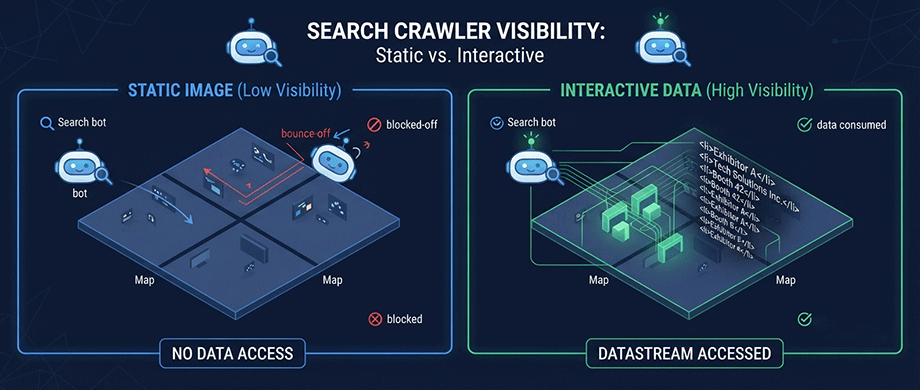
This is the hidden benefit that justifies the development cost.
- Indexable Content: Text inside a JPEG or PDF is largely invisible to search engines. If you list your 200 exhibitors in a static image, you miss 200 opportunities to rank. An interactive map is backed by HTML text (lists, divs, or JSON data), meaning Google can crawl "Exhibitor Name + [Event Name]".
- Pre-Event Traffic: By publishing an indexable map early, you capture traffic from attendees researching specific vendors before the show starts.
- Schema Integration: You can wrap exhibitor data in Event or Organization schema, helping your event appear in "Rich Snippets" for queries related to your participating companies.
6. Reusing the Map Year After Year
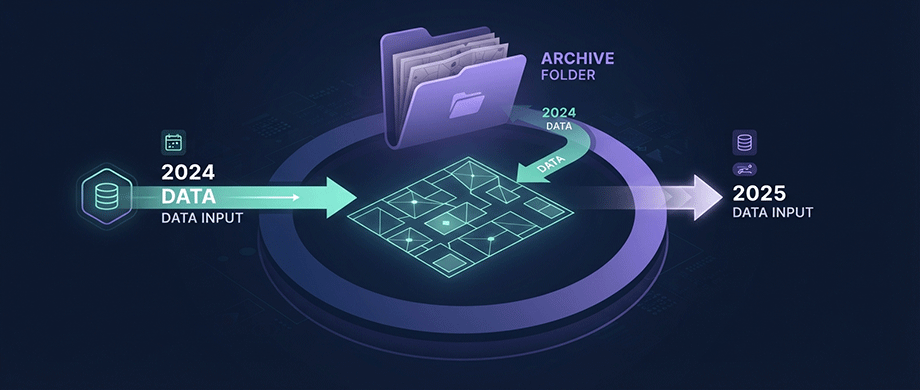
A static map is a disposable asset; an interactive map is a reusable platform.
- Database vs. Drawing: With a static map, next year's changes require a graphic designer to redraw the layout. With an interactive map, the geometry (booths) often stays the same; you simply update the database (CSV) of which company occupies which booth.
- Archives: You can easily archive previous years' maps on sub-URLs (e.g., /2026/map), creating a historical record without cluttering your current media library with massive PDF files.
Conclusion: Beyond Navigation (The Map as an Event Hub)
An interactive map does more than just prevent attendees from getting lost; it bridges the gap between physical presence and digital discovery. By transforming your floor plan into a searchable, indexable, and data-rich directory, you elevate the entire event experience. You provide value to exhibitors through better visibility, clarity to attendees through smart wayfinding, and long-term SEO benefits to your brand. Stop treating your map as a static picture and start treating it as the central operating system of your event's physical space.

About the Author
Botrous Kerolos has been designing and building interactive maps for the web since 2009 — from early Flash/SWF maps to modern SVG — and leads development at WP Map Plugins, helping WordPress sites turn static content into fast, accessible, interactive experiences.