Table of Contents
- The Performance Problem with Interactive Maps
- Lazy-Loading: Don't Load What Users Don't Need
- Optimizing SVG Vector Maps for Speed
- JavaScript Optimization: Code-Splitting and Bundle Reduction
- Managing API Calls and External Dependencies
- WordPress-Specific Optimization
- Advanced: Vector Tile Optimization
- Conclusion
1. The Performance Problem with Interactive Maps
What Makes Maps So Heavy?
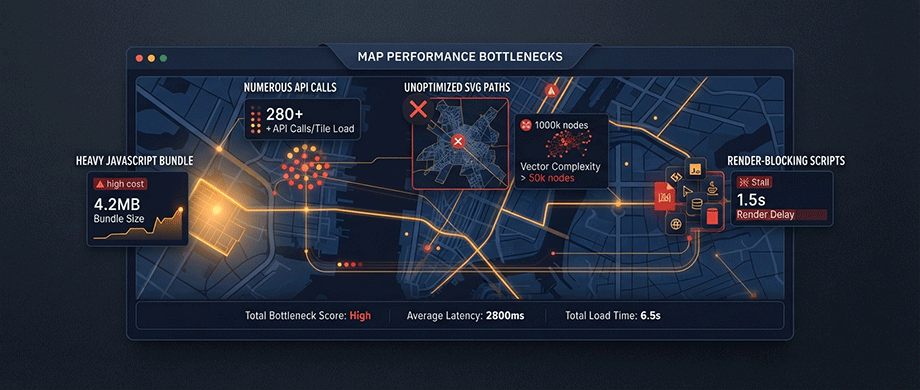
Interactive maps present a perfect storm of performance challenges:
- JavaScript Bloat: Mapping libraries are massive. Leaflet + react-leaflet can add ~140 KB minified to your bundle. Google Maps API loads additional scripts that can block subsequent page rendering. Every extra script is fetched, parsed, compiled, and executed—all before your user can interact with the page.
- Vector Data Size: Detailed SVG maps can be enormous. Depending on the level of detail, a custom SVG map can often be significantly smaller than many JavaScript-based mapping libraries, especially when compressed with gzip or Brotli. Complex vector tiles with thousands of features can exceed practical network and browser rendering budgets.
- API Request Costs: Each map load, geocoding request, or address search triggers billable API calls. Beyond the financial cost, these external requests add latency that delays page rendering.
- Render-Blocking Operations: Rendering thousands of points or paths in one blocking operation can freeze the main thread, making the page unresponsive. Heavy work like rendering a complex map can freeze the main thread entirely.
The Core Web Vitals Impact
Slow maps affect all three Core Web Vitals:
- LCP: If your map is above the fold and loads slowly, it becomes the LCP element, delaying the largest contentful paint.
- INP: Heavy JavaScript execution during map interactions (pan, zoom, click) delays user response times.
- CLS: Maps that load after surrounding content can push elements down the page, causing layout shifts.
2. Lazy-Loading: Don't Load What Users Don't Need
The Default Should Be Lazy
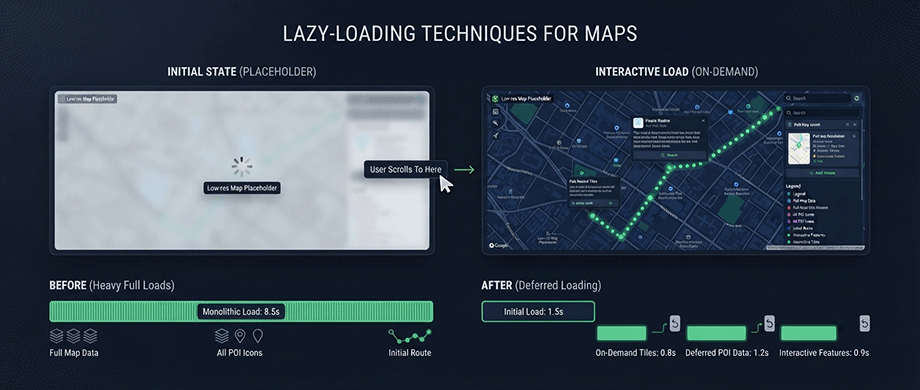
Most page visitors never interact with the map. Research consistently shows that many users scroll past maps or leave the page before engaging. Why load heavy map libraries for everyone?.
Modern mapping solutions offer lazy-loading by default. The Nuxt Scripts Google Maps component, for example, only loads the JavaScript API on mouseenter, mouseover, or mousedown. Before that, a lightweight static image placeholder is shown. This approach avoids the Maps JavaScript API charge for most sessions and significantly improves initial load time.
Lazy-Loading Implementation Strategies
Trigger-Based Loading:
mouseenter/mouseover: Load when user hovers near the map area.mousedown: Load only on explicit click or tap.visible: Load when the element enters the viewport.
For maps below the fold, loading on visible prevents the map from affecting LCP at all. For Google Maps specifically, trigger="visible" can be a simple and effective optimization.
Component-Level Lazy-Loading:
In modern front-end frameworks, dynamic imports split heavy map components into separate chunks:
javascript
// React exampleconst DeploymentMap = React.lazy(() => import('./components/maps/DeploymentMap'));
// In your component
<Suspense fallback={<div>Loading map...div>}>

      <DeploymentMap />

      </Suspense>
This approach dropped the main bundle under 500 KB in one implementation, with Leaflet split into a separate chunk that only loads when the map is visible.
Chunked Rendering for Heavy Data
javascript
const CHUNK_SIZE = 500;for (let i = 0; i < data.length; i += CHUNK_SIZE) { const chunk = data.slice(i, i + CHUNK_SIZE); // Add points for chunk // Yield to browser between chunks if (i + CHUNK_SIZE < data.length) { await new Promise(resolve => setTimeout(resolve, 0)); }}
This technique ensures the page remains interactive during rendering, and users see progress rather than a frozen browser.
3. Optimizing SVG Vector Maps for Speed
File Size Is the Primary Bottleneck
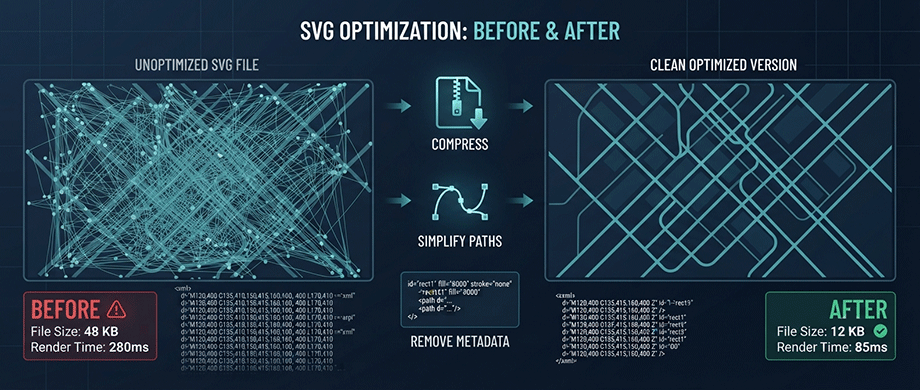
The most direct path to faster SVG maps is reducing file size. A typical SVG map might be 600 KB uncompressed. Optimization tools can dramatically reduce this—often by 70-80% without noticeable quality loss.
SVGO and Modern Alternatives:
SVGO (SVG Optimizer) is the standard tool for optimizing SVG files. It removes redundant information, simplifies paths, and applies various compression techniques. A custom map that started at 600 KB was reduced to 70 KB gzipped through SVGO optimization.
For even better performance, consider Vexy SVGO, a Rust-based alternative that's 12x faster than SVGO on npx, 7x faster on bunx for large files. It implements over 50+ optimization plugins including:
- Structural: Remove comments, empty attributes, useless definitions.
- Shape: Convert shapes to paths, merge paths, simplify path data.
- Color: Convert colors, minify styles, remove unused style elements.
- Advanced: Apply transforms, inline styles, cleanup IDs.
Path Simplification Trade-Offs
Path simplification reduces file size by reducing decimal precision and eliminating unnecessary points. However, there's a trade-off: excessive simplification degrades visual quality.
One caveat: some mapping libraries have limitations on optimized SVG paths. Highcharts, for example, historically didn't support compressed paths where spaces were removed between elements (e.g., "19-69" instead of "19 -69"). Always test optimized SVGs in your specific mapping environment.
SVG vs. GeoJSON vs. TopoJSON
The format you choose significantly impacts performance. By file size: SVG > GeoJSON > TopoJSON, with TopoJSON being the smallest. If your mapping tool supports multiple formats, consider using the more compressed options for better performance
4. JavaScript Optimization: Code-Splitting and Bundle Reduction
The Bundle Size Problem
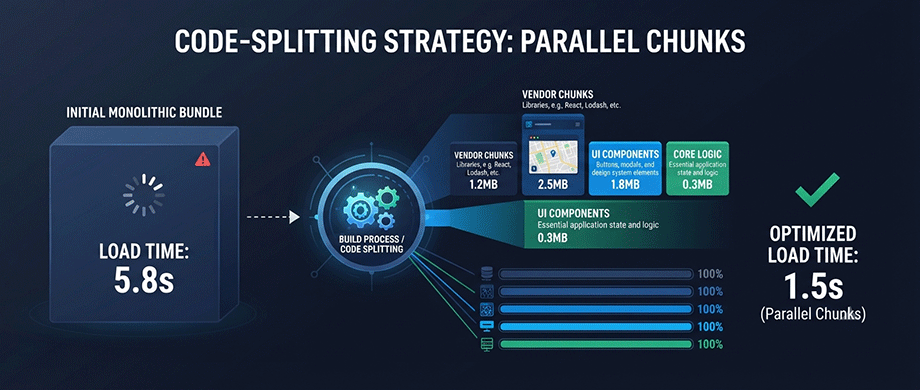
Many WordPress sites accumulate JavaScript over time, with plugin after plugin adding scripts that load on every page. A single bundle exceeding 500 KB gzipped is a warning sign, and 1.7 MB bundles are all too common. This bloat directly impacts LCP, FCP, and TTI.
Code-Splitting Strategies
- Route-Based Splitting: Lazy load pages that users may not visit.
- Vendor Splitting: Separate third-party libraries (React, mapping libraries, UI frameworks) from your application code. This improves caching since vendors change less frequently.
- Component-Level Splitting: Lazy load heavy components like maps, charts, or rich text editors. For Next.js, use
next/dynamicwithssr: falsefor client-only components.
Trim Unnecessary JavaScript
Audit your bundle regularly. Use Coverage in DevTools to identify unused code, remove forgotten libraries, and lazy-load code that's only needed later. Removing or deferring unnecessary third-party scripts, such as outdated chat widgets, can improve responsiveness and reduce input latency, particularly on slower devices.
For WordPress sites, proper script ordering is critical. Reorganize the enqueue order to prioritize essential scripts like jQuery and core theme files, and move heavy third-party scripts lower in the loading sequence.
Defer and Async Loading
Configure scripts to load asynchronously or deferred:.
PHP
// In WordPress, use wp_script_add_data()
wp_script_add_data($handle, 'defer', true);
WP Rocket's "Load JavaScript Deferred" and "Delay JavaScript Execution" features can significantly improve Core Web Vitals scores. For Google Maps specifically, loading the API before dependent scripts prevents render-blocking delays.
The Canvas Renderer Option
For many path layers (polylines, circles, polygons), the Canvas renderer is 10-100x faster than SVG. If you're drawing real-time breadcrumb trails or thousands of paths, setting preferCanvas: true can dramatically improve performance
5. Managing API Calls and External Dependencies
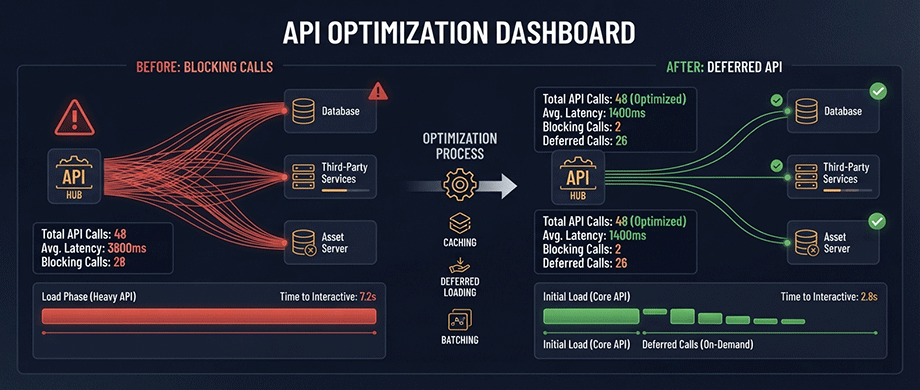
The Google Maps API Cost Trap
Google Maps API calls are both expensive and performance-heavy. The default lazy-loading approach in modern components avoids the Maps JavaScript API charge for most sessions. Only load the map when the user actually needs it.
If you must load Google Maps on page load, ensure it loads before dependent scripts to prevent cascading delays. For maps above the fold, use a placeholder image to avoid blocking LCP while still providing immediate visual context.
Debounce and Throttle Event Handlers
Unthrottled event handlers can destroy performance. The move event on a map runs roughly 60 times per second during pan—every time the user drags the map.
javascript.
// ❌ BAD: Runs ~60 times per second during pan
map.on('move', () => {
updateVisibleFeatures(); // Expensive query
fetchDataFromAPI(); // Network request
updateUI(); // DOM manipulation
});
// ✅ GOOD: Throttle during interaction, finalize on idle
let throttleTimeout;
map.on('move', () => {
if (throttleTimeout) return;
throttleTimeout = setTimeout(() => {
updateMapCenter(); // Cheap update
throttleTimeout = null;
}, 100);
});
// Expensive operations after interaction stops
map.on('moveend', () => {
updateVisibleFeatures();
fetchDataFromAPI();
updateUI();
});
Debounce reverse geocoding on map move at 300-500ms, and use requestAnimationFrame for rendering updates
Query Only What You Need
When querying map features, don't query all layers:.
javascript
// ❌ BAD: Query all features (expensive)
const features = map.queryRenderedFeatures(e.point);
// ✅ GOOD: Query specific layers only
const features = map.queryRenderedFeatures(e.point, {
layers: ['restaurants', 'shops']
});
For touch targets, use a bounding box and apply additional filters to narrow results further.
6. WordPress-Specific Optimization
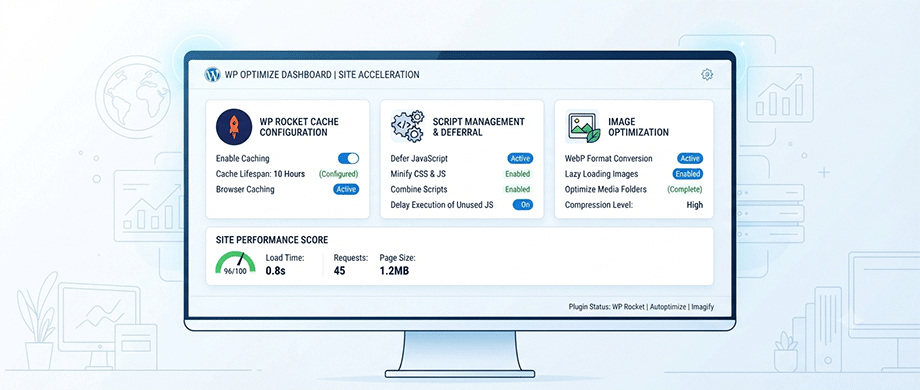
Script Management
WordPress sites accumulate scripts from plugins, themes, and custom code. A structured optimization plan focuses on:
- Audit: Identify redundant or late-loading scripts, review dependencies.
- Reorganize: Prioritize essential scripts (jQuery, Beaver Builder core, theme scripts).
- Defer: Enable Load JavaScript Deferred and Delay JavaScript Execution in caching plugins.
- Exclude: Keep only essential scripts from deferral/exclusion lists.
Image Optimization
External images bypass WordPress optimization—they can't be converted to WebP or lazy-loaded. Migrate externally hosted images into the WordPress media library. Confirm below-the-fold images use loading="lazy" while excluding above-the-fold content.
Heavy Widget Placement
Map widgets, social feeds, and other heavy elements should be moved lower on the page, away from the critical rendering path. Avoid adding multiple heavy widgets on the same page, as each has different loading times that can compound to hurt LCP.
7. Advanced: Vector Tile Optimization
The Unbounded Tile Problem
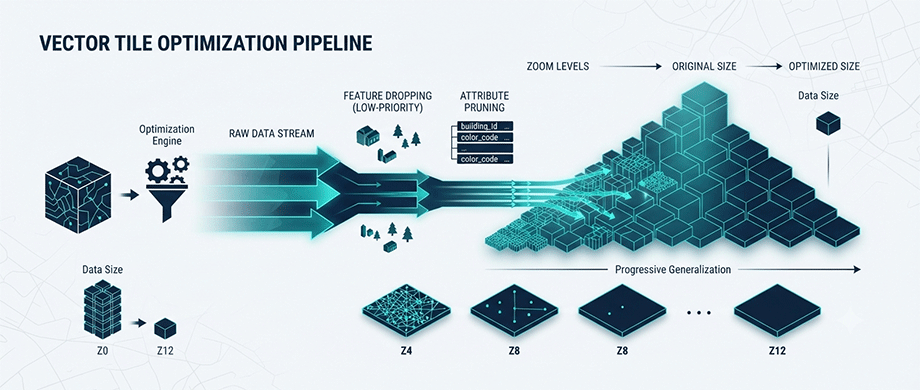
Vector tiles are not naturally size-bounded. Payload can grow arbitrarily with feature density, geometry complexity, and attribute cardinality. Unlike raster tiles, which have a fixed pixel limit, vector tiles can easily exceed practical network and browser rendering budgets.
Feature Dropping and Simplification
Modern dynamic tiling approaches prioritize larger, more visible features over smaller ones. This process removes invisible details and reduces the size of the data significantly. For point data, aggregation into discrete grids at varying resolutions keeps tile size under control in a predictable way.
Attribute Pruning
Not all attributes are equally important. A generated UUID consumes space but provides little value for visualization. A 2026 research paper introducing the HiFIVE framework formalizes this exact challenge as the "visualization-aware tile reduction problem" — the tradeoff between tile size and visual accuracy — and shows it's computationally intractable to solve perfectly at scale. Their approach prunes records, attributes, and values at each tile using information-theoretic and spatial relevance criteria, reporting significant tile-size reductions while preserving visual quality even at terabyte-scale datasets. (arXiv:2603.10270)
Caching and CDN
A Content Delivery Network (CDN) ensures the same data isn't processed multiple times, reducing unnecessary computing load. Data resulting from SQL queries is point-in-time and cached for extended periods; full tables are cached differently depending on the data warehouse platform.
Conclusion: Keep Your Maps Fast, Keep Your Visitors Engaged
Interactive maps are among the most powerful tools for engagement on the web, but they come with a performance cost. The strategies outlined in this guide—lazy-loading, SVG optimization, code-splitting, and careful JavaScript management—will help you strike the right balance between richness and speed.
If you are ready to add interactive maps to your WordPress site without sacrificing speed, discover how our premium Interactive WordPress Map Plugins delivers beautiful, self-hosted SVG maps with zero external API dependencies—so your maps load fast, stay fast, and keep your Core Web Vitals green.

About the Author
Botrous Kerolos has been designing and building interactive maps for the web since 2009 — from early Flash/SWF maps to modern SVG — and leads development at WP Map Plugins, helping WordPress sites turn static content into fast, accessible, interactive experiences.